Identifying your most popular stories of the year
|
Click play to LISTEN to the article below
|
As we approach the end of the year, many publishers are eager to review any data that can help them develop a strategy for producing high-quality, engaging content to keep readers coming back in the year ahead.
That same data can be useful for marketing purposes, such as adjusting advertising costs for specific categories or types of content that attract more readers.
While there are countless techniques for examining visitor trends, a great place to start is the Our-Hometown Stats Platform.
(All customers on the Our-Hometown WordPress Publishing Platform should have an account to access the OHT Stats Platform. If you do not have an account, or have forgotten your password, please contact us by email at ops@our-hometown.com to request a new login.)
The Our-Hometown Stats Platform records several statistics for measuring your website’s traffic and engagement and allows you to generate a report for a specific time period that you’re interested in analyzing further.
Today, we’re going to take a look at how to identify your website’s most popular stories of 2022.
1. Selecting a Date Filter
When you first log into the stats platform, you’ll notice that by default, each statistic being measured is only showing numbers for the current day you are viewing, i.e. “Today.”
You’ll want to adjust the date filter to display the stats for the entire year.
Near the top of the page, you’ll see a button with a small calendar icon. Click this button to adjust the date filter, and mark the radio button next to “Year.” Once you have select the “Year” option, click on any date on the 2022 calendar to select “2022” as the year you want to view stats for.
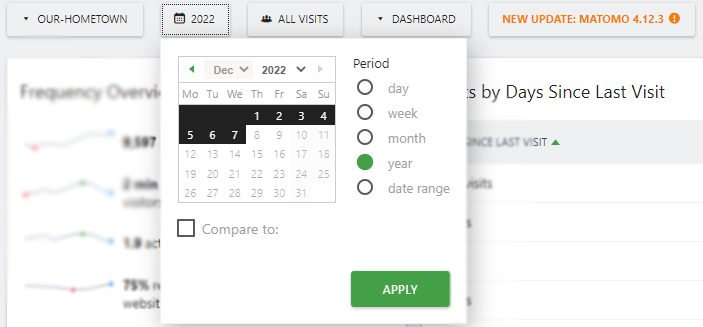
Click Apply to save your filter.
2. Finding your Top Stories of the Year
Once you’ve applied your date filter, any stats that you see will be reflective of the entire year. Now, we just need to navigate to a list of our most popular pages and articles.
On the menu to the left, navigate to Behaviour -> Page Titles.
This page will list all of the Articles and Pages that have been visited within the selected time period, identified by the Page/Article Title.
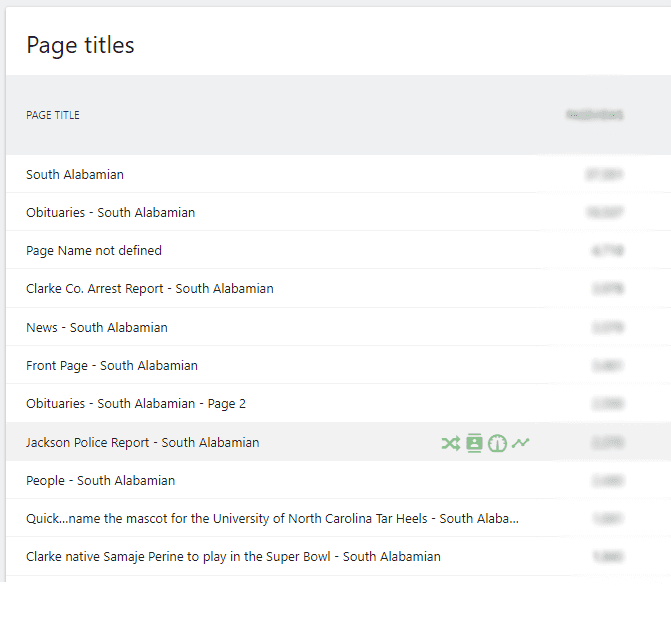
To the right of each Page/Article Title is the number of visitors, unique visitors, the visitor bounce rate, the average time spent on the page per visitor, and a few other useful statistics.
This list will include static pages, such as your homepage, About Us, Contact Us, and other pages that do not change, as well as category pages such as your News, Sports, and Opinion pages.
3. Viewing Only Articles
If you’re not interested in stats for static pages and really only want to see how your published Articles performed, we’ll instead want to navigate to Behaviour -> Pages.
This page is similar to the Page Titles area we viewed before, but you’ll notice that each piece of content is broken down by the content type. For example, you will see the word “articles” listed with a plus sign next to it that you can click to expand the category to see all of the articles that recorded stats in the selected time period.
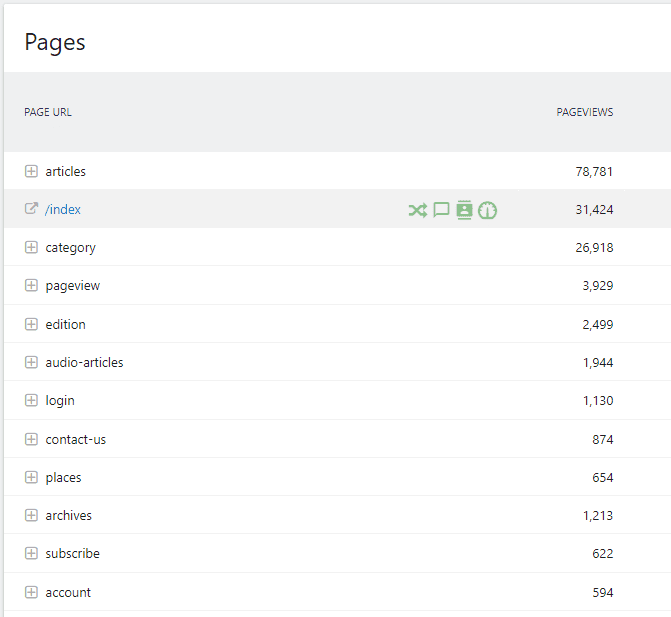
Content is broken down by content type 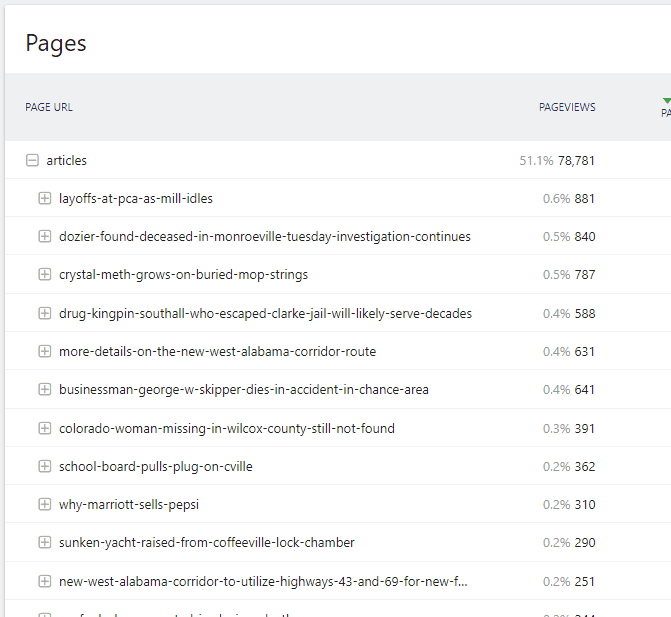
Expand articles to view all articles
This is an easy way to filter the content so that you’re only viewing statistics for articles rather than your homepage and other static content pages, which traditionally receive more views than any specific article.
Using these techniques, you can see what types of content attracted the most visitors and kept them engaged and on-site for the longest period of time this year. Your “most popular stories” of 2022 are the stories with the most pageviews and unique pageviews, and you can use this information to help determine where to prioritize your reporting focus in the year ahead.
If you have any questions, e-mail us at ops@our-hometown.com and we’ll get back to you as quickly as possible!
- ← Kevin Slimp: To-Do List for Newspapers as we Approach the New Year
- Update your Contact Information at Our-Hometown →


Recent Comments